Profiling R code: microbenchmark vs bench
Wickham (2019) is a nice book if you want to learn more about
The following is an example of comparing the timing performance of columnwise averages. We generate a 100 by 500 matrix, then we compute column means by colMeans(), apply(), and a code with a for loop.
library(dplyr)
library(knitr)
library(bench)
library(microbenchmark)

colMeans_apply <- function(x) apply(x, 2, mean)
colMeans_for <- function(x){
  p = dim(x)[2]
  colmeans = rep(NA, p)
  for(i in 1:p){
    colmeans[i] = mean(x[,i])
  }
  return(colmeans)
}

x <- matrix(rnorm(100*500),100,500)
First, we take a look the outputs from microbenchmark::microbenchmark(). It evaluates performance based on times repetitions (the default value is 100). The summary table of the outputs provides the average timing performance and the five-number summary. You can also create a boxplot of the benchmark result. This function is useful when the functions have short running time. On the other hand, we should use smaller times when a function takes long (for example, 10 second per iteration). However, it does not provide memory profiling results. The code lines below prints the summary of the the benchmark result of the example.
res_microbenchmark <- microbenchmark(colMeans(x),
                                     colMeans_apply(x),
                                     colMeans_for(x),
                                     times = 100)
summary(res_microbenchmark) %>% kable(label="Profiling result by microbenchmark::microbenchmark()")| expr | min | lq | mean | median | uq | max | neval |
|---|---|---|---|---|---|---|---|
| colMeans(x) | 24.988 | 25.7095 | 29.11964 | 27.874 | 31.390 | 42.834 | 100 |
| colMeans_apply(x) | 1596.544 | 1736.5195 | 2036.95895 | 1881.381 | 1981.623 | 10828.227 | 100 |
| colMeans_for(x) | 1257.546 | 1344.1905 | 1856.67222 | 1539.776 | 1591.371 | 9853.577 | 100 |
boxplot(res_microbenchmark)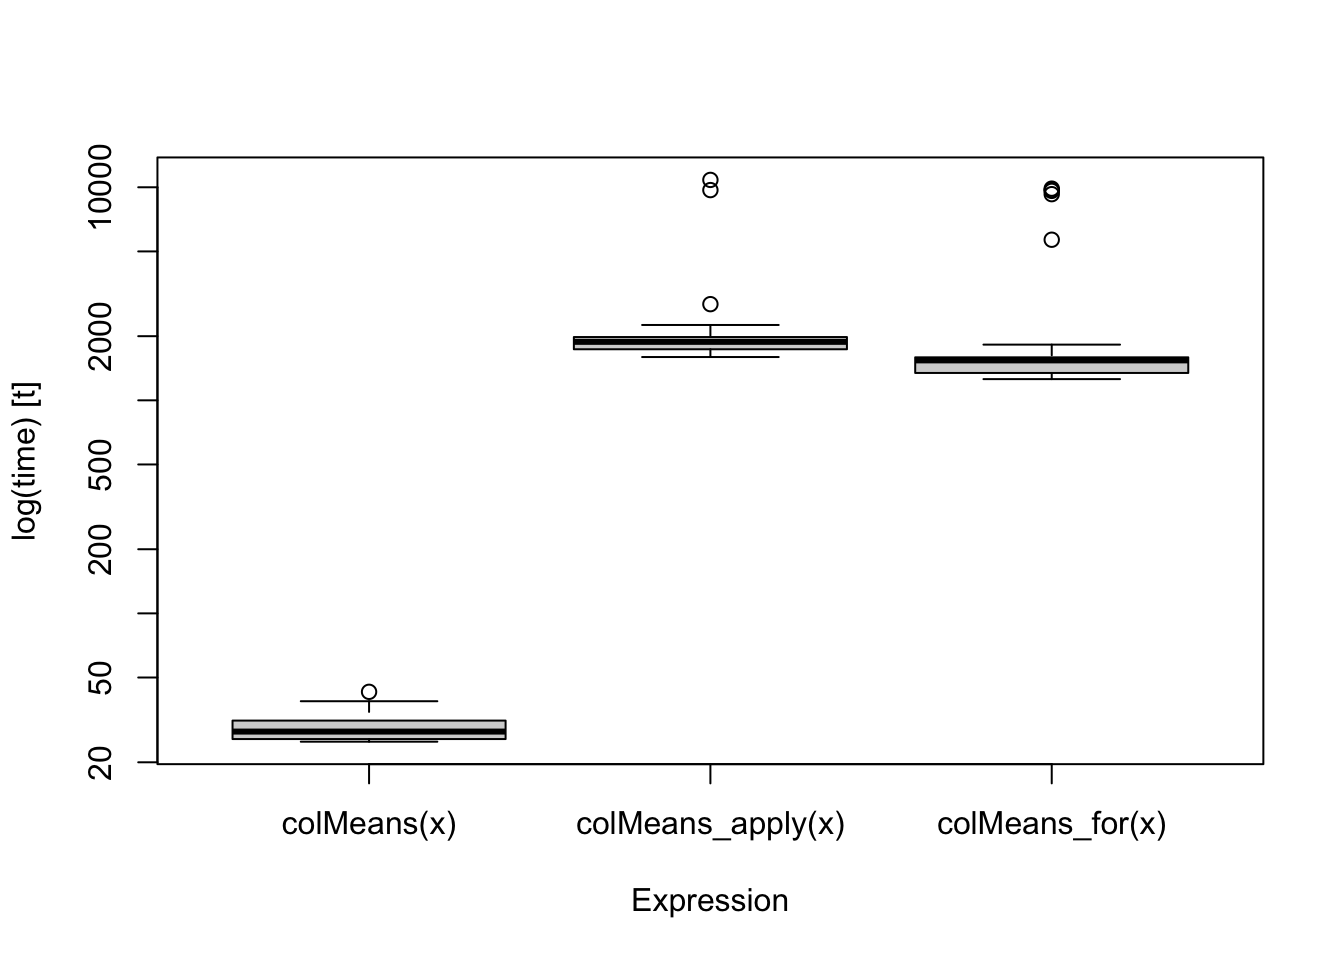
Next, we use bench::mark() for profiling. It allows us to use either fixed number of iterations or a flexible choice automatically. The result table below displays the number of iterations and running times. For example, colMeans() takes less than 30 nanoseconds per iteration in average, which is computed from 9999 iterations. Meanwhile, columnwise means by apply function takes 1.76 microseconds per iteration, which is computed from 227 iterations. Moreover, it also provides memory-usage profiling, which is a nice feature of this package. Lastly, it checks whether the results are consistent when we set check = TRUE. This makes the function saving results, so we can check the consistency.
res_mark<-mark(colMeans(x), colMeans_apply(x),colMeans_for(x), check = TRUE)
res_mark[,1:8] %>% kable(label="Profiling result by bench::mark()")| expression | min | median | itr/sec | mem_alloc | gc/sec | n_itr | n_gc |
|---|---|---|---|---|---|---|---|
| colMeans(x) | 25.59µs | 27.68µs | 35602.2158 | 3.95KB | 3.560578 | 9999 | 1 |
| colMeans_apply(x) | 1.59ms | 1.78ms | 543.4457 | 1.01MB | 19.408775 | 224 | 8 |
| colMeans_for(x) | 1.28ms | 1.35ms | 713.6653 | 638.77KB | 27.070064 | 290 | 11 |
all.equal(res_mark$result[[1]],res_mark$result[[2]])## [1] TRUEIn summary, both packages provide convenient tools for profiling. I still don’t know many features provided by bench, so I’ll learn how to use the package.
sessionInfo()## R version 4.1.1 (2021-08-10)
## Platform: x86_64-apple-darwin17.0 (64-bit)
## Running under: macOS Big Sur 10.16
##
## Matrix products: default
## LAPACK: /Library/Frameworks/R.framework/Versions/4.1/Resources/lib/libRlapack.dylib
##
## locale:
## [1] en_US.UTF-8/en_US.UTF-8/en_US.UTF-8/C/en_US.UTF-8/en_US.UTF-8
##
## attached base packages:
## [1] stats graphics grDevices utils datasets methods base
##
## other attached packages:
## [1] microbenchmark_1.4-7 bench_1.1.1 knitr_1.34
## [4] dplyr_1.0.7
##
## loaded via a namespace (and not attached):
## [1] magrittr_2.0.1 tidyselect_1.1.1 R6_2.5.1 rlang_0.4.11
## [5] fastmap_1.1.0 fansi_0.5.0 highr_0.9 stringr_1.4.0
## [9] tools_4.1.1 xfun_0.26 utf8_1.2.2 jquerylib_0.1.4
## [13] htmltools_0.5.2 ellipsis_0.3.2 yaml_2.2.1 digest_0.6.28
## [17] tibble_3.1.4 lifecycle_1.0.1 crayon_1.4.1 bookdown_0.24
## [21] purrr_0.3.4 sass_0.4.0 vctrs_0.3.8 glue_1.4.2
## [25] evaluate_0.14 rmarkdown_2.11 blogdown_1.5 stringi_1.7.4
## [29] compiler_4.1.1 bslib_0.3.0 pillar_1.6.3 generics_0.1.0
## [33] profmem_0.6.0 jsonlite_1.7.2 pkgconfig_2.0.3Youngseok Song
Assistant Professor in Statistics
My research interests include high-dimensional inference, graphical modeling, network analysis, robust statistics, robust learing, and statistical genomics.